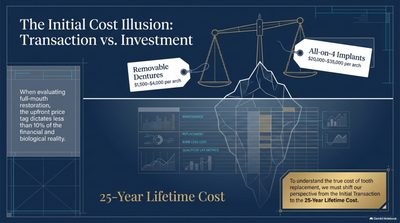
Two Curves, One Crossover
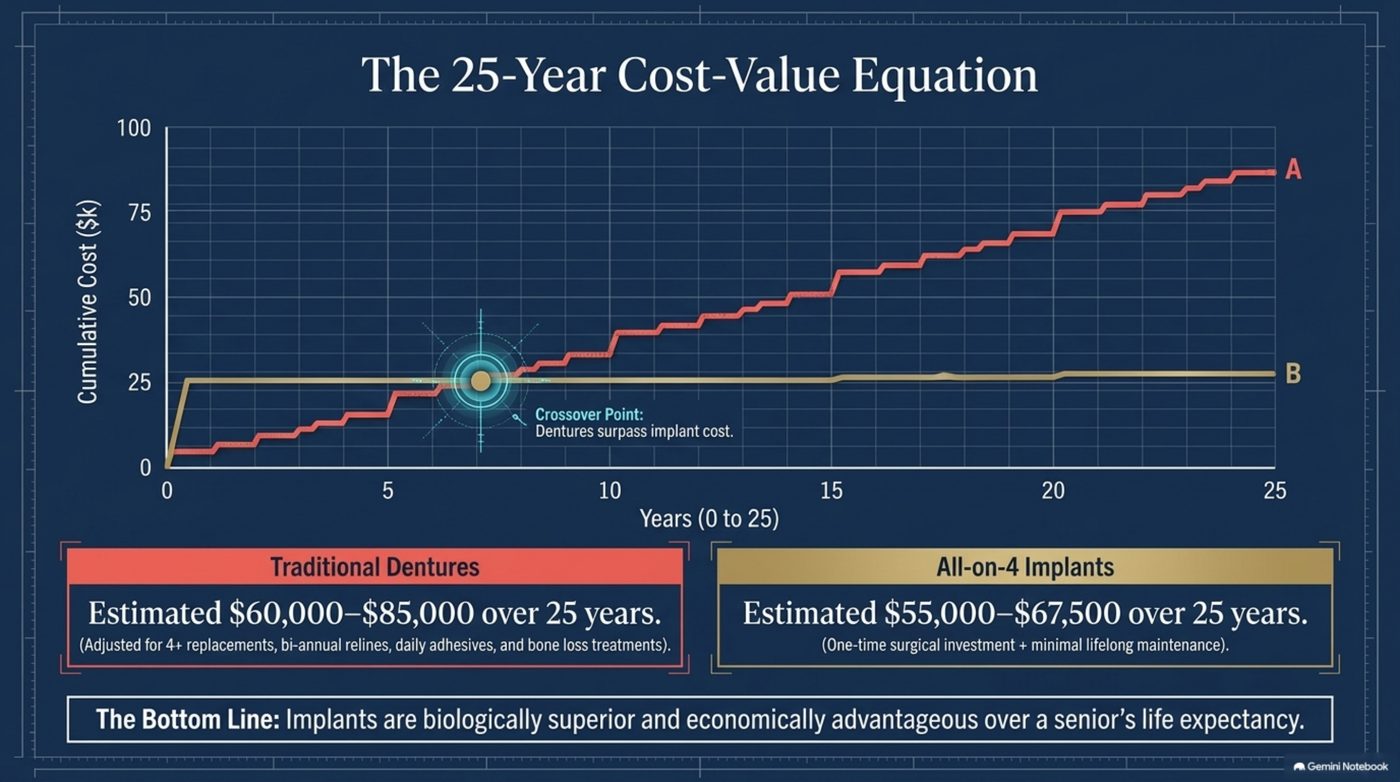
Plot the two main full-mouth pathways on the same axes and the shapes tell the story before any single number does. One curve starts low and climbs steadily. The other starts high and then flattens. Somewhere along the 25-year axis the two lines cross, and everything after that crossover is the difference between them.
Reading that chart is the entire exercise. A decision made at year zero is being made for a line that continues to year 25.
The 25-Year Cumulative Numbers
| Pathway | Estimated 25-year cumulative cost | What drives it |
|---|---|---|
| Traditional dentures | $60,000–$85,000 | |
| All-on-4 implants | $55,000–$67,500 |
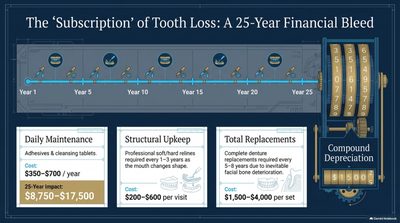
The denture estimate is not a single purchase repeated. It is four or more replacement sets, professional relines roughly twice a year, daily adhesive and cleansing supplies, and the treatment of bone loss as the ridge changes. Each of those is defensible on its own. Together they create the upward slope.
The implant estimate is dominated by the surgery and then goes quiet. Once the surgical investment is made, the ongoing requirement is routine maintenance rather than a recurring rebuild.
Why the Crossover Matters More Than the Price Tag
The crossover point is the year in which the denture curve overtakes the implant curve. Before it, the removable path has cost less overall. After it, the arithmetic reverses, and every additional year widens the gap. Because the crossover arrives well within the horizon most adults are planning for, the framing that matters is not which is cheaper now but which is cheaper across the years the restoration will actually be used.
- Early years: the entry price favors the removable appliance.
- Middle years: relines and the first replacement sets pull the curve upward.
- Crossover: the compounding maintenance overtakes the one-time investment.
- Later years: the gap widens in favor of the anchored restoration.
The crossover also moves with assumptions, which is why the assumptions matter as much as the result. Shorten the replacement interval and it arrives sooner. Raise the reline frequency and the removable curve steepens. Across most realistic combinations the crossover still lands well inside the 25-year window, which is what makes the long frame the honest one. Compare the same two pathways across five years instead and the conclusion inverts, which is the trap the horizon question exists to expose.
What the Ranges Hide
Both estimates are ranges because both pathways contain variables. On the removable side, the interval between replacements shortens as the jaw changes shape, and reline frequency follows the rate of that change. On the anchored side, the surgical investment is a fixed event and the maintenance that follows is routine, so the range is narrower and mostly reflects the scope of the initial work.
A wide range is not uncertainty for its own sake. It is the signature of a cost stream that responds to the body rather than to a fixed schedule.
The Biological Half of the Equation
Cost is only one axis. The other is what each pathway does to the foundation across the same 25 years. A removable appliance leaves the ridge unloaded, so the jaw narrows and the appliance is refilled to keep pace. An anchored restoration loads the bone with every bite, which is why the maintenance requirement stays flat instead of climbing.
The financial curve and the biological curve are driven by the same mechanism, which is why they point in the same direction rather than trading off against each other.
Why This Matters Over a Normal Life Expectancy
The practical conclusion is that the anchored pathway is both biologically stronger and economically favorable across a senior's life expectancy. Not by a margin that shows up in year one, but by the margin that shows up at the crossover and grows from there.
Anyone comparing the two options in Scottsdale should ask for the cumulative projection across the full horizon rather than the opening quote, because the opening quote is the part of the chart where the two options look furthest apart in the opposite direction.
How to Use the Chart in a Consultation
Bring the chart to the conversation rather than the other way around. Ask for the cumulative projection across the full horizon, with the replacement intervals and reline frequency stated explicitly so both curves are built from real assumptions instead of defaults. Ask where the crossover falls, and what single assumption moves it.
Then ask the question the chart cannot answer by itself: what is happening to the foundation underneath each curve. A projection that shows the removable line climbing is describing an appliance being refitted to a jaw that is changing. A projection that shows the anchored line flattening is describing a structure that is holding its own foundation in place as it works.
Both answers belong in the same conversation, because one mechanism is driving the cost curve and the biological curve at the same time.
Free calculators: denture vs implant ledger cost benchmark table 25-year ledger — all on the Scottsdale tools hub.
Frequently Asked Questions
What exactly is the crossover point?
It is the year when cumulative denture spending passes cumulative implant spending. Before it the removable path is ahead on total cost, and after it the anchored path is.
Why does the denture estimate carry such a wide range?
Because replacement intervals and reline frequency vary with how quickly each jaw changes shape. The range reflects four or more replacement sets across the horizon on the low end and faster cycles on the high end.
Are the implant figures all-inclusive?
They represent the one-time surgical investment plus minimal lifelong maintenance, which is the whole point of the shape of that curve.